
![]()
![]()

![]()
![]()
![]()
logolink is an R package that simplifies setting
up and running NetLogo
simulations directly from R. It provides a modern, intuitive interface
that follows tidyverse
principles and integrates seamlessly with the tidyverse ecosystem.
The package is designed to work with NetLogo 7.0.1 and above. Earlier versions are not supported. See NetLogo’s Transition Guide to upgrade your models if needed.
If you find this project useful, please consider giving it a star!
The continuous development of
logolinkdepends on community support. If you can afford to do so, please consider becoming a sponsor.
While other R packages connect R to NetLogo, logolink is
currently the only one that fully supports the latest NetLogo release.
It is actively maintained, follows tidyverse conventions, and is
designed to be simple and straightforward to use.
For context, RNetLogo
supports only older versions (up to 6.0.0, released in December 2016)
and has not been updated since June 2017. nlrx
offers a powerful framework for managing experiments and results, but supports
only up to NetLogo 6.3.0 (released in September 2022), requires
additional system dependencies, uses its own internal conventions that
diverge from NetLogo standards, and has many unresolved
issues.
logolink complements these packages by prioritizing
simplicity, offering finer control over output, ensuring full
compatibility with NetLogo 7, and integrating seamlessly with modern R
workflows.
You can install the released version of logolink from CRAN with:
install.packages("logolink")And the development version from GitHub with:
# install.packages("remotes")
remotes::install_github("danielvartan/logolink")logolink usage is very straightforward. The main
functions are:
create_experiment:
Create NetLogo BehaviorSpace experimentrun_experiment:
Run NetLogo BehaviorSpace experimentAlong with this package, you will also need NetLogo 7.0.1 or higher installed on your computer. You can download it from the NetLogo website.
After installing NetLogo and logolink, start by loading
the package with:
library(logolink)logolink will try to find out the path to the NetLogo
installation automatically. This is usually successful, but if it fails,
you can set it manually. See the documentation for the run_experiment
function for more details.
To start our example analysis, we’ll need to first specify the path to the NetLogo model.
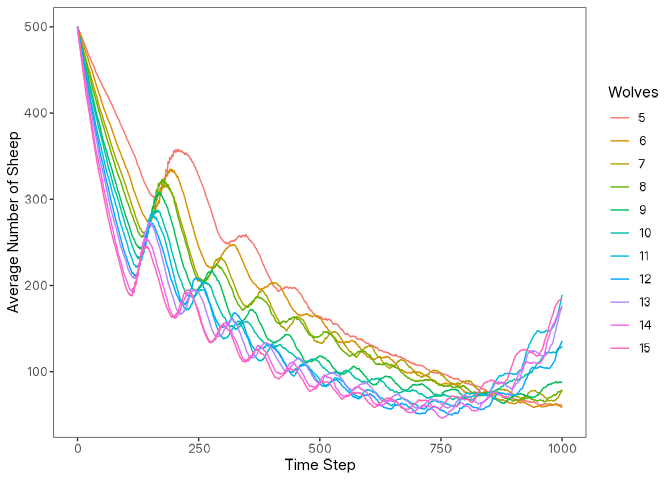
This example uses Wilensky’s Wolf Sheep Simple model, a classic predator-prey simulation grounded in the Lotka-Volterra equations developed by Alfred J. Lotka (1925) and Vito Volterra (1926). Since this model comes bundled with NetLogo, no download is required.
We’ll use find_netlogo_home
function to locate the NetLogo installation directory, then build the
path to the model file:
model_path <-
  find_netlogo_home() |>
  file.path(
    "models",
    "IABM Textbook",
    "chapter 4",
    "Wolf Sheep Simple 5.nlogox"
)To run the model from R, we’ll need to setup an experiment. We can do
this by setting a BehaviorSpace
experiment with the create_experiment
function. This function will create a BehaviorSpace XML file that contains all
the information about the experiment, including the parameters to vary,
the metrics to collect, and the number of runs to perform.
setup_file <- create_experiment(
  name = "Wolf Sheep Simple Model Analysis",
  repetitions = 10,
  sequential_run_order = TRUE,
  run_metrics_every_step = TRUE,
  setup = "setup",
  go = "go",
  time_limit = 1000,
  metrics = c(
    'count wolves',
    'count sheep'
  ),
  run_metrics_condition = NULL,
  constants = list(
    "number-of-sheep" = 500,
    "number-of-wolves" = list(
      first = 5,
      step = 1,
      last = 15
    ),
    "movement-cost" = 0.5,
    "grass-regrowth-rate" = 0.3,
    "energy-gain-from-grass" = 2,
    "energy-gain-from-sheep" = 5
  )
)
Alternatively, you can set up your experiment directly
in NetLogo and save it as part of your model. In this case, you can
skip the create_experiment
step and just provide the name of the experiment when running the model
with run_experiment.
With the experiment file created, we can now run the model using the
run_experiment
function. This function will execute the NetLogo model with the
specified parameters and return the results as tidy data frames.
results <-
  model_path |>
  run_experiment(
    setup_file = setup_file
  )
#> ✔ Running model [13.4s]
#> ✔ Gathering metadata [15ms]
#> ✔ Processing table output [8ms]logolink supports the four
output formats available in BehaviorSpace: Table,
Spreadsheet,
Lists,
and Statistics.
By default, only the Table
format is returned, along with some metadata about the experiment
run.
library(dplyr)

results |> glimpse()
#> List of 2
#>  $ metadata:List of 6
#>   ..$ timestamp       : POSIXct[1:1], format: "2026-01-08 05:11:42"
#>   ..$ netlogo_version : chr "7.0.3"
#>   ..$ output_version  : chr "2.0"
#>   ..$ model_file      : chr "Wolf Sheep Simple 5.nlogox"
#>   ..$ experiment_name : chr "Wolf Sheep Simple Model Analysis"
#>   ..$ world_dimensions: Named int [1:4] -17 17 -17 17
#>   .. ..- attr(*, "names")= chr [1:4] "min-pxcor" "max-pxcor" "min-pycor" "max-pycor"
#>  $ table   : tibble [110,110 × 10] (S3: tbl_df/tbl/data.frame)
#>   ..$ run_number            : num [1:110110] 1 1 1 1 1 1 1 1 1 1 ...
#>   ..$ number_of_sheep       : num [1:110110] 500 500 500 500 500 500 500 500 500 500 ...
#>   ..$ number_of_wolves      : num [1:110110] 5 5 5 5 5 5 5 5 5 5 ...
#>   ..$ movement_cost         : num [1:110110] 0.5 0.5 0.5 0.5 0.5 0.5 0.5 0.5 0.5 0.5 ...
#>   ..$ grass_regrowth_rate   : num [1:110110] 0.3 0.3 0.3 0.3 0.3 0.3 0.3 0.3 0.3 0.3 ...
#>   ..$ energy_gain_from_grass: num [1:110110] 2 2 2 2 2 2 2 2 2 2 ...
#>   ..$ energy_gain_from_sheep: num [1:110110] 5 5 5 5 5 5 5 5 5 5 ...
#>   ..$ step                  : num [1:110110] 0 1 2 3 4 5 6 7 8 9 ...
#>   ..$ count_wolves          : num [1:110110] 5 5 5 5 5 5 5 5 5 5 ...
#>   ..$ count_sheep           : num [1:110110] 500 499 499 498 495 494 492 489 488 486 ...
If you already have a file with experiment results, you can read it
into R using the read_experiment
function, which will produce the same output structure as run_experiment.
Below is a simple example of how to visualize the results using ggplot2.
library(dplyr)
library(magrittr)

data <-
  results |>
  extract2("table") |>
  select(where(is.numeric)) |>
  summarize(
    across(everything(), ~ mean(.x, na.rm = TRUE)),
    .by = c(step, number_of_wolves)
  ) |>
arrange(number_of_wolves, step)library(ggplot2)
data |>
mutate(number_of_wolves = as.factor(number_of_wolves)) |>
ggplot(
aes(
x = step,
y = count_sheep,
group = number_of_wolves,
color = number_of_wolves
)
) +
geom_line() +
labs(
x = "Time Step",
y = "Average Number of Sheep",
color = "Wolves"
)
logolink also includes tutorials to help you get the
most out of NetLogo in R. The Visualizing
the NetLogo World tutorial demonstrates how to plot the NetLogo
world at specific time steps and animate its evolution over time.
Click here to
see the full list of logolink functions.
For complete guidance on setting up and running experiments in NetLogo, please refer to the BehaviorSpace Guide.
![]()
If you use this package in your research, please cite it to acknowledge the effort put into its development and maintenance. Your citation helps support its continued improvement.
citation("logolink")
#> To cite logolink in publications use:
#>
#>   Vartanian, D. (2026). logolink: An interface for running NetLogo
#>   simulations from R [Computer software]. CRAN.
#>   https://doi.org/10.32614/CRAN.package.logolink
#>
#> A BibTeX entry for LaTeX users is
#>
#>   @Misc{,
#>     title = {logolink: An interface for running NetLogo simulations from R},
#>     author = {Daniel Vartanian},
#>     year = {2026},
#>     doi = {10.32614/CRAN.package.logolink},
#>     note = {Computer software},
#> }![]()
Copyright (C) 2025 Daniel Vartanian

logolink is free software: you can redistribute it and/or modify it under the
terms of the GNU General Public License as published by the Free Software
Foundation, either version 3 of the License, or (at your option) any later
version.

This program is distributed in the hope that it will be useful, but WITHOUT ANY
WARRANTY; without even the implied warranty of MERCHANTABILITY or FITNESS FOR A
PARTICULAR PURPOSE. See the GNU General Public License for more details.

You should have received a copy of the GNU General Public License along with
this program. If not, see <https://www.gnu.org/licenses/>.![]()
Contributions are always welcome! Whether you want to report bugs, suggest new features, or help improve the code or documentation, your input makes a difference.
Before opening a new issue, please check the issues tab to see if your topic has already been reported.
You can also support the development of logolink by
becoming a sponsor.
Click here to
make a donation. Please mention logolink in your donation
message.
logolink brand identity is based on the NetLogo 7 brand identity.

