| Title: | Evaluation of Binary Classifiers |
| Version: | 0.1.4 |
| Description: | Evaluates the performance of binary classifiers. Computes confusion measures (TP, TN, FP, FN), derived measures (TPR, FDR, accuracy, F1, DOR, ..), and area under the curve. Outputs are well suited for nested dataframes. |
| License: | GPL-3 |
| URL: | https://abichat.github.io/evabic/, https://github.com/abichat/evabic |
| BugReports: | https://github.com/abichat/evabic/issues |
| Suggests: | testthat (≥ 2.1.0) |
| Encoding: | UTF-8 |
| Language: | en-US |
| RoxygenNote: | 7.3.3 |
| NeedsCompilation: | no |
| Packaged: | 2025-12-12 22:53:37 UTC; antoinebichat |
| Author: | Antoine Bichat  [aut, cre]
 |
| Maintainer: | Antoine Bichat <antoine.bichat@proton.me> |
| Repository: | CRAN |
| Date/Publication: | 2025-12-12 23:10:02 UTC |
Add names to a vector
Description
Add names to a vector, with default names.
Usage
add_names(x, names = NULL, prefix = "x")
Arguments
x |
A vector. |
names |
Vector of names to add. If |
prefix |
The prefix to add before default names. Useful only if
|
Value
A named vector
Examples
add_names(month.name)
Area Under the Curve
Description
Compute area under the curve by using the rectangle's method.
Usage
area_rect(x, y)
Arguments
x |
Numeric. |
y |
Numeric. |
Value
A numeric.
Examples
x <- c(0, 0, 0.5, 1)
y <- c(0, 0.5, 0.5, 1)
plot(x, y, type = "b")
evabic:::area_rect(x, y)
Area under the curve
Description
Compute the Area Under the Curve for a classification.
Usage
ebc_AUC(
  detection_values,
  true,
  all,
  m = length(all),
  direction = c("<", ">", "<=", ">=")
)

ebc_AUC_from_measures(df_measures)
Arguments
detection_values |
Values corresponding to elements that are detected. Must be named. |
true |
Vector of element that are supposed to be detected. |
all |
Vector of all elements. |
m |
Total number of elements. |
direction |
With |
df_measures |
A dataframe with |
Value
A numeric.
Examples
set.seed(42)
X1 <- rnorm(50)
X2 <- rnorm(50)
X3 <- rnorm(50)
predictors <- paste0("X", 1:3)
df_lm <- data.frame(X1 = X1, X2 = X2, X3 = X3,
                    X4 = X1 + X2 + X3 + rnorm(50, sd = 0.5),
                    X5 = X1 + 3 * X3 + rnorm(50, sd = 0.5),
                    X6 = X2 - 2 * X3 + rnorm(50, sd = 0.5),
                    X7 = X1 - X2 + rnorm(50, sd = 2),
                    Y  = X1 - X2 + 3 * X3 + rnorm(50))
model <- lm(Y ~ ., data = df_lm)
pvalues <- summary(model)$coefficients[-1, 4]
ebc_AUC(pvalues, predictors, m = 7)

df_measures <- ebc_tidy_by_threshold(pvalues, predictors, m = 7)
ebc_AUC_from_measures(df_measures)
Confusion measures.
Description
Basic measures from the confusion matrix.
Usage
ebc_TP(detected, true)

ebc_FP(detected, true)

ebc_FN(detected, true)

ebc_TN(detected, true, all, m = length(all))
Arguments
detected |
Vector of elements that are detected. |
true |
Vector of element that are supposed to be detected. |
all |
Vector of all elements. |
m |
Total number of elements. |
Details
See ebc_allmeasures for the description of the measures.
Value
An integer.
See Also
ebc_TPR, ebc_tidy,
ebc_allmeasures
Examples
ebc_TP(detected = c("A", "C", "D"), true = c("A", "B", "C"))
ebc_FP(detected = c("A", "C", "D"), true = c("A", "B", "C"))
ebc_FN(detected = c("A", "C", "D"), true = c("A", "B", "C"))
ebc_TN(detected = c("A", "C", "D"), true = c("A", "B", "C"),
       all = LETTERS[1:6])
ebc_TN(detected = c("A", "C", "D"), true = c("A", "B", "C"), m = 6)
Derived measures.
Description
Measures derived from confusion matrix.
Usage
ebc_TPR(detected, true)

ebc_TNR(detected, true, all, m = length(all))

ebc_PPV(detected, true)

ebc_NPV(detected, true, all, m = length(all))

ebc_FNR(detected, true)

ebc_FPR(detected, true, all, m = length(all))

ebc_FDR(detected, true)

ebc_FOR(detected, true, all, m = length(all))

ebc_ACC(detected, true, all, m = length(all))

ebc_BACC(detected, true, all, m = length(all))

ebc_F1(detected, true)

ebc_PLR(detected, true, all, m = length(all))

ebc_NLR(detected, true, all, m = length(all))

ebc_DOR(detected, true, all, m = length(all))
Arguments
detected |
Vector of elements that are detected. |
true |
Vector of element that are supposed to be detected. |
all |
Vector of all elements. |
m |
Total number of elements. |
Details
See ebc_allmeasures for the description of the measures.
Value
A numeric.
See Also
ebc_TP, ebc_tidy,
ebc_allmeasures
Examples
ebc_TPR(detected = c("A", "C", "D"), true = c("A", "B", "C"))
ebc_ACC(detected = c("A", "C", "D"), true = c("A", "B", "C"),
        all = LETTERS[1:5])
Available measures
Description
Available measures in evabic
Usage
ebc_allmeasures
Format
An object of class character of length 18.
Details
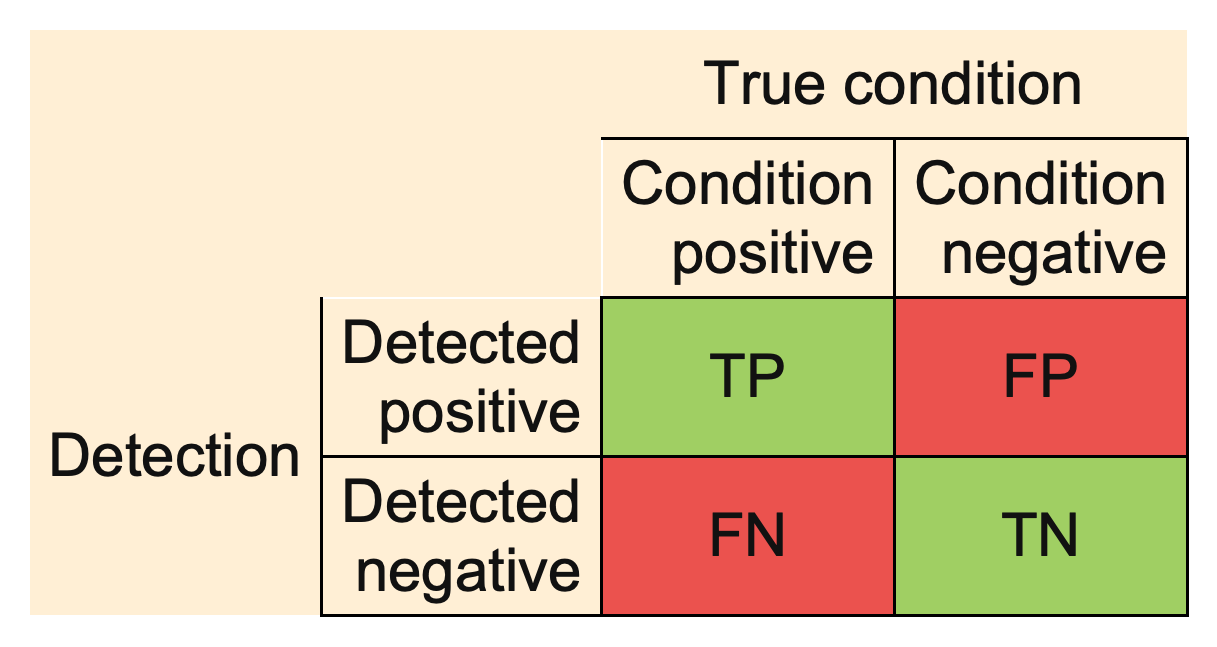
- TP
True Positive
- FP
False Positive
- FN
False Negative
- TN
True Negative
- TPR
True Positive Rate or Sensitivity or Recall or Power
TPR = \frac{TP}{TP + FN} = 1 - FNR- TNR
True Negative Rate or Specificity
TNR = \frac{TN}{FP + TN} = 1 - FPR- PPV
Positive Predictive Value or Precision
PPV = \frac{TP}{TP + FP} = 1 - FDR- NPV
Negative Predictive Value
NPV = \frac{TN}{TN + FN} = 1 - FOR- FNR
False Negative Rate or Type II Error Rate or Miss Rate
FNR = \frac{FN}{TP + FN} = 1 - TPR- FPR
False Positive Rate or Type I Errors Rate or Fall-out
FPR = \frac{FP}{FP + TN} = 1 - TNR- FDR
False Discovery Rate
FDR = \frac{FP}{FP + TP} = 1 - PPV- FOR
False Omission Rate
FOR = \frac{FN}{TN + FN} = 1 - NPV- ACC
Accuracy
ACC = \frac{TP + TN}{TP + FP + FN + TN}- BACC
Balanced Accuracy
BACC = \frac{\frac{TP}{TP + FN} + \frac{TN}{FP + TN}}{2}- F1
F1 Score
F1 = \frac{2 TP}{2TP + FP + FN} = \frac{2}{\frac{1}{TPR} + \frac{1}{PPV}}- PLR
Positive Likelihood Ratio or LR+ or Likelihood Ratio for Positive Results
PLR = \frac{TPR}{1 - TNR}- NLR
Negative Likelihood Ratio or LR- or Likelihood Ratio for Negative Results
NLR = \frac{1 - TPR}{TNR}- DOR
Diagnostic Odds Ratio
DOR = \frac{\frac{TP}{FP}}{\frac{FN}{TN}}
                       = \frac{PLR}{NLR}
References
https://en.wikipedia.org/wiki/Evaluation_of_binary_classifiers
Examples
ebc_allmeasures
Confusion matrix
Description
Compute the the confusion matrix
Usage
ebc_confusion(detected, true, all, m = length(all), prop = FALSE)
Arguments
detected |
Vector of elements that are detected. |
true |
Vector of element that are supposed to be detected. |
all |
Vector of all elements. |
m |
Total number of elements. |
prop |
Logical, default to |
Details
See ebc_allmeasures for the description of the measures.
Value
A 2*2 named matrix.
Examples
ebc_confusion(detected = c("A", "C", "D"), true = c("A", "B", "C"), m = 6)
Tidy output for measures
Description
Construct a single row summary of the classifier.
Usage
ebc_tidy(
  detected,
  true,
  all,
  m = length(all),
  measures = c("TPR", "FPR", "FDR", "ACC", "F1")
)
Arguments
detected |
Vector of elements that are detected. |
true |
Vector of element that are supposed to be detected. |
all |
Vector of all elements. |
m |
Total number of elements. |
measures |
Desired measures of performance. |
Details
See ebc_allmeasures for the available measures and
their descriptions.
Value
A single-row data.frame with one column per
element in measures.
See Also
ebc_TP, ebc_TPR,
ebc_allmeasures
Examples
ebc_tidy(detected = c("A", "C", "D"), true = c("A", "B", "C"),
         all = LETTERS[1:6], measures = c("ACC", "FDR"))
Measures by threshold
Description
Computes measures according to a moving threshold.
Usage
ebc_tidy_by_threshold(
  detection_values,
  true,
  all,
  m = length(all),
  measures = c("TPR", "FPR", "FDR", "ACC", "F1"),
  direction = c("<", ">", "<=", ">=")
)
Arguments
detection_values |
Values corresponding to elements that are detected. Must be named. |
true |
Vector of element that are supposed to be detected. |
all |
Vector of all elements. |
m |
Total number of elements. |
measures |
Desired measures of performance. |
direction |
With |
Details
See ebc_allmeasures for the available measures and
their descriptions.
Value
A dataframe with one column called threshold and other corresponding
to those specified in measures.
Examples
set.seed(42)
X1 <- rnorm(50)
X2 <- rnorm(50)
X3 <- rnorm(50)
predictors <- paste0("X", 1:3)
df_lm <- data.frame(X1 = X1, X2 = X2, X3 = X3,
                    X4 = X1 + X2 + X3 + rnorm(50, sd = 0.5),
                    X5 = X1 + 3 * X3 + rnorm(50, sd = 0.5),
                    X6 = X2 - 2 * X3 + rnorm(50, sd = 0.5),
                    X7 = X1 - X2 + rnorm(50, sd = 2),
                    Y  = X1 - X2 + 3 * X3 + rnorm(50))
model <- lm(Y ~ ., data = df_lm)
pvalues <- summary(model)$coefficients[-1, 4]
ebc_tidy_by_threshold(pvalues, predictors, m = 7)
Named logical to character
Description
Extracts names of x where x is TRUE
Usage
nl2c(x)
Arguments
x |
vector |
Value
a vector of the same size
Examples
x <- c(a = TRUE, b = FALSE, c = FALSE, d = TRUE)
evabic:::nl2c(x)
Repeat 0
Description
Repeat 0
Usage
rep_0(n)
Arguments
n |
The number of time to repeat |
Value
A character.